
Overview: Empowering a User-Centric Transformation
By leveraging the Kano model for feature prioritization, we enabled the Product team to define the product roadmap with a keen focus on customer satisfaction and efficient investment. This process not only shaped the research methodology for roadmap development but also played a pivotal role in driving the company towards a user-centric approach.
My Role
UX Researcher
Company
Fiserv
Timeline
2 months
Responsibilities
1. Planning & designing the study
2. Analysing the resultsAnalysing the results
3. Reporting & Presenting the findings
Tools
- Userzoom
- Excel
- Figma
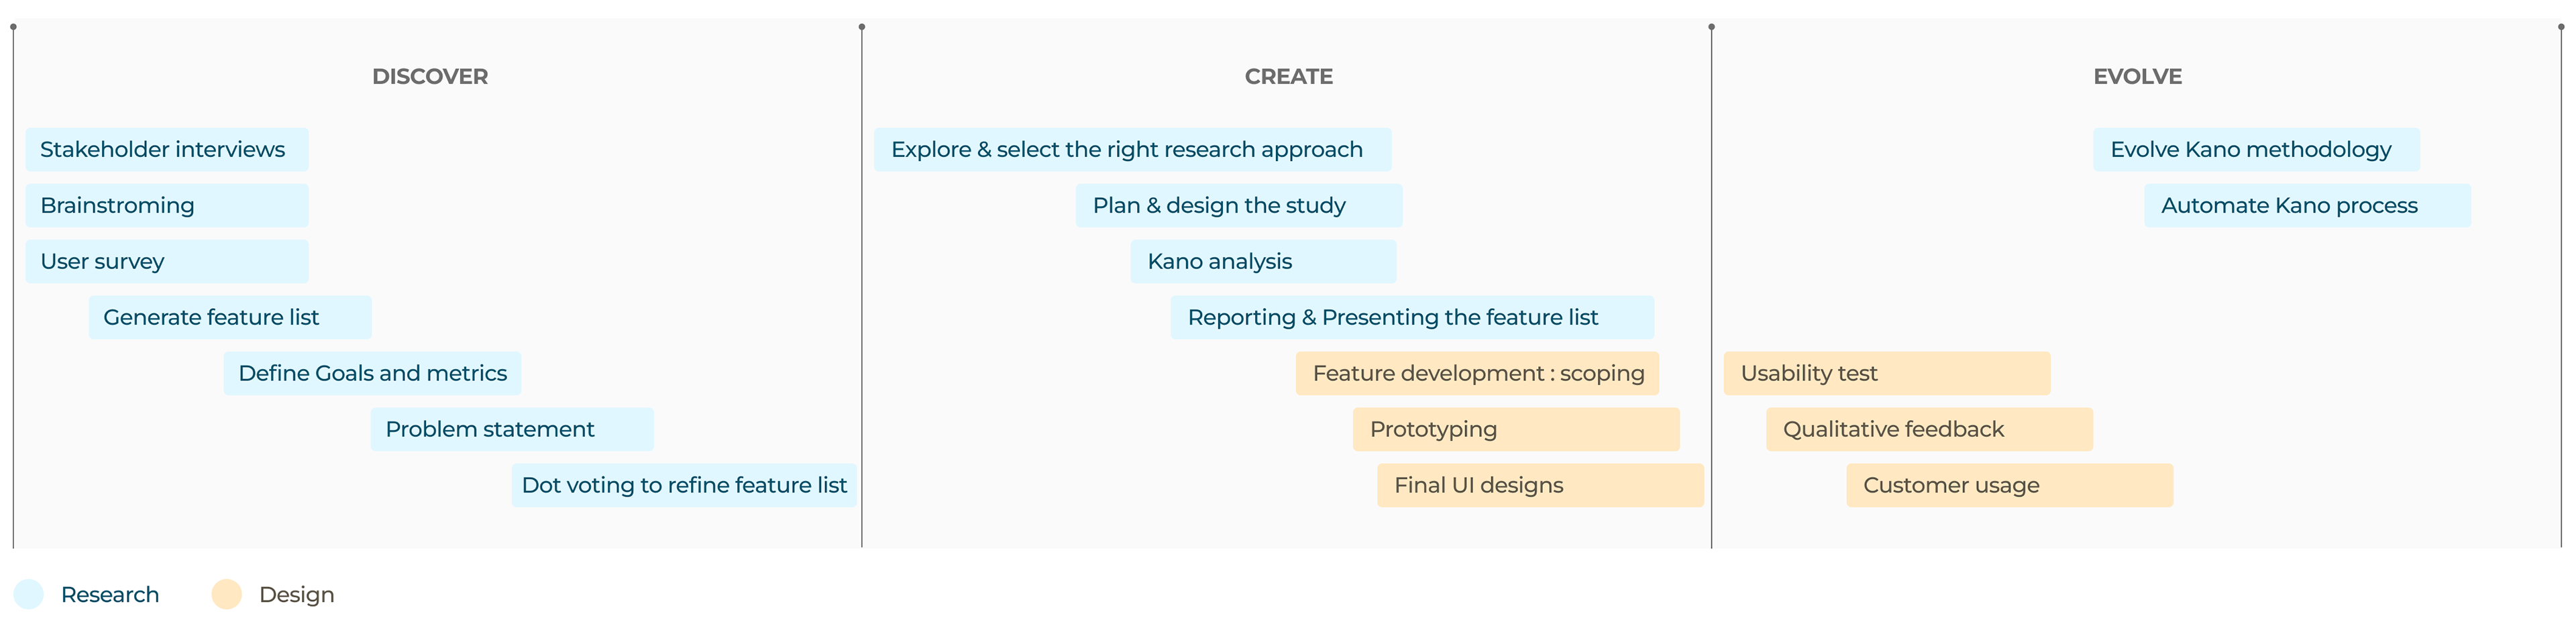
Process
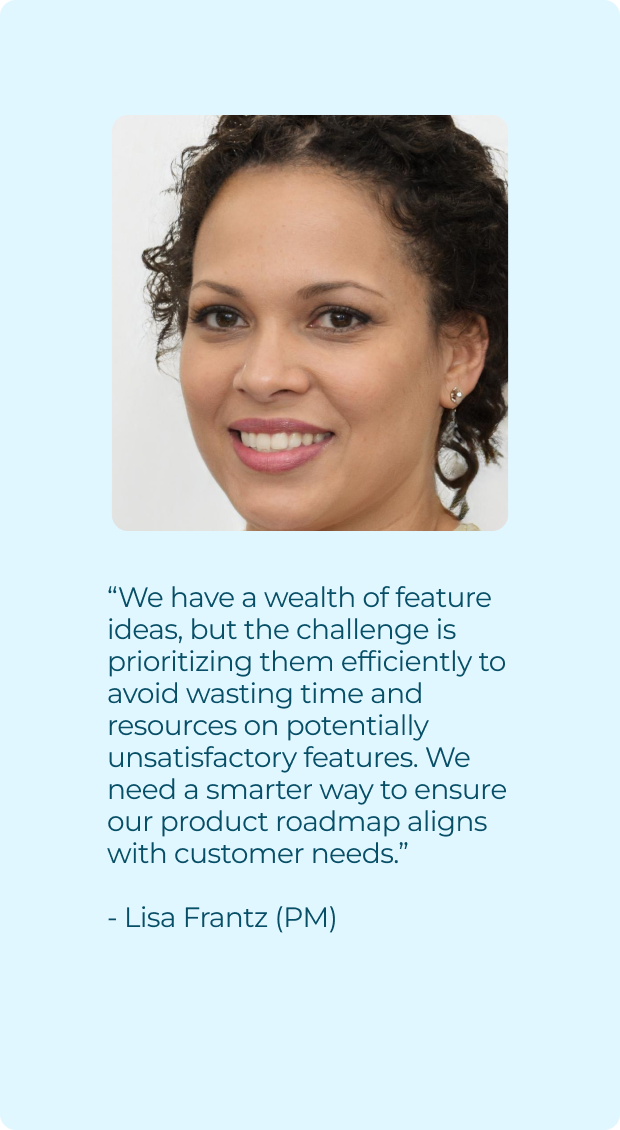
Problem Statement
The company's banking product met core customer needs but faced growing requests for improvements. With a wealth of feature ideas, the challenge was to prioritize efficiently, avoid wasting time and resources on potentially unsatisfactory features, and ensure a streamlined product roadmap. To address these issues, a Kano Analysis for effective feature evaluation and resource optimization was chosen.

The Need For Kano Analysis
Kano analysis is invaluable for product teams seeking answers to fundamental questions:
- How can we measure customer satisfaction?
- What features can we create to increase customer satisfaction?
- Do our current features cause high customer satisfaction?
- How can we enhance our features to delight customers at an optimal level?
By focusing on these critical questions and addressing customer needs, product teams can identify the essential factors that determine whether their product can enter, sustain itself, and excel in a target market.
Objective
Prioritize and Develop Features Based on Customer Satisfaction Scores
Impact measurement: Customer usage, Qualitative feedback from users
Optimize Time and Cost Efficiency in Developing High-Satisfaction Features
Impact measurement: Time saved, Cost reduction, Feature success rate, User feedback, Feature adoption rate, Development team productivity, Resource allocation efficiency
Kano Process
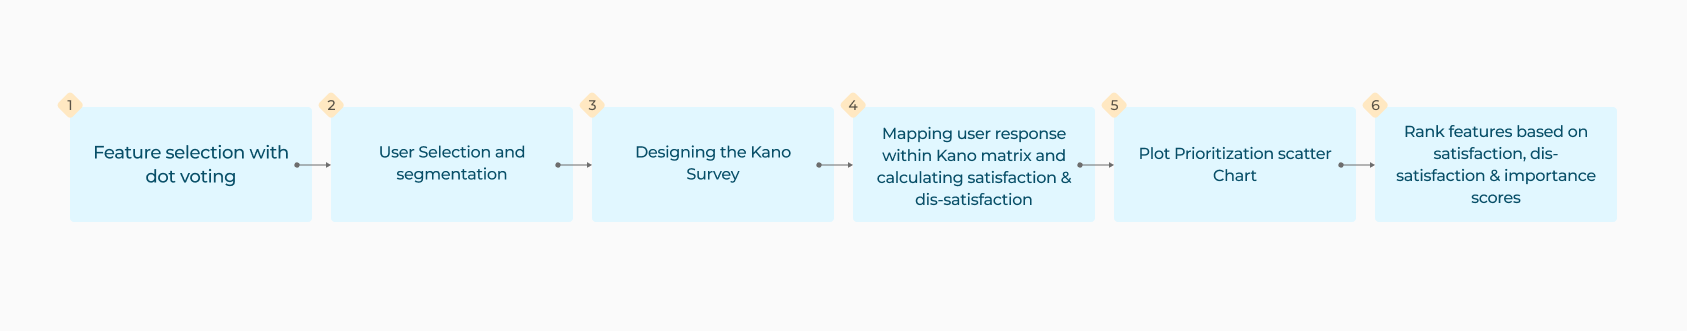
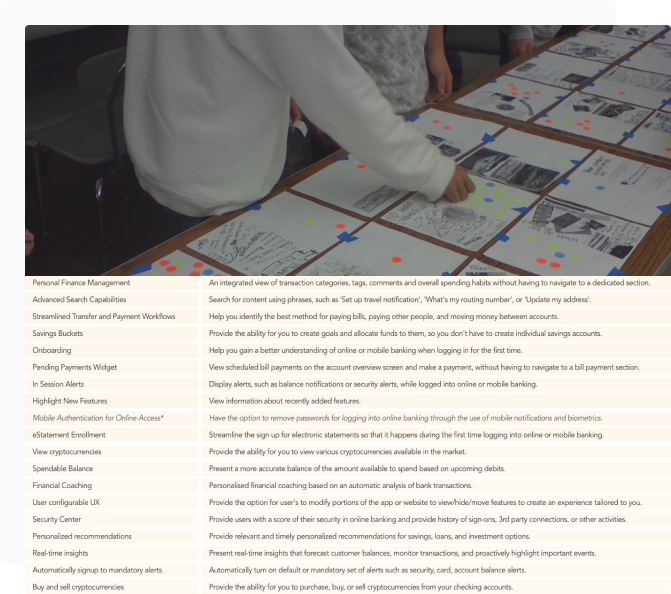
Step 1: Feature selection with dot voting
In this step, a Dot Voting was employed to select features, resulting in a refined list of approximately 20 high-potential features.
Step 2: Use selection and segmentation
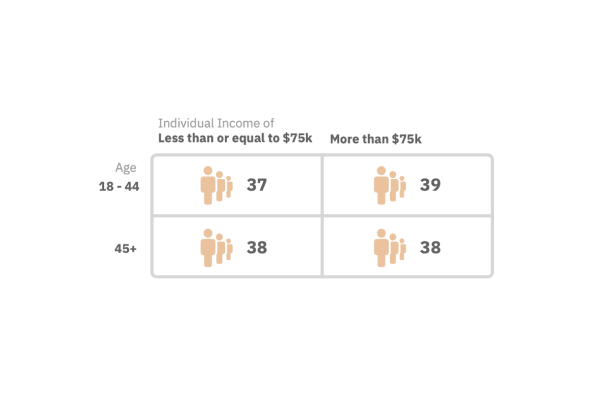
In this phase, 152 participants were carefully selected across the United States, ensuring diversity by categorizing them into four groups based on age and income: "Young Rich," "Young Poor," "Old Rich," and "Old Poor." Participants, regardless of gender, were required to be regular users of banking applications. To maintain the integrity of the study, individuals with backgrounds in market research or financial technology were excluded.
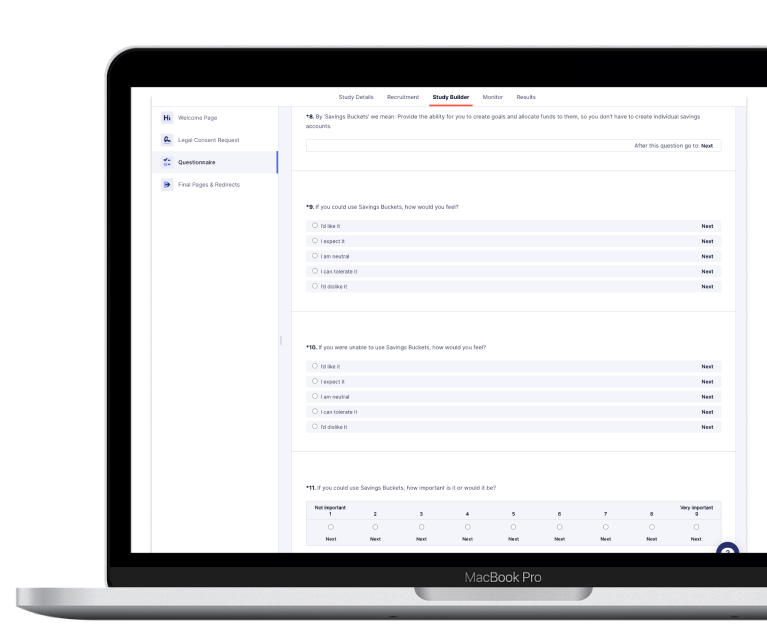
Step 3: Designing the Kano Survey
The UserZoom platform was used to create a comprehensive Kano survey. For each feature, we a concise description was provided. Participants were presented with two sets of questions to gauge user sentiments—one set assuming they could use the feature and the other assuming they couldn't. Additionally, participants rated the importance of each feature and had the opportunity to provide comments.
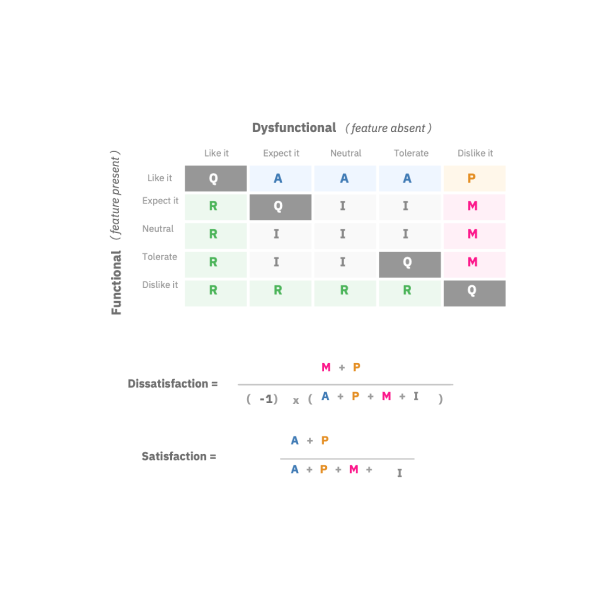
Step 4: Mapping user response within Kano matrix and calculating satisfaction & dis-satisfaction coeffecients
We analyzed user responses from sentiment analysis questions, which included one response for 'could have' and another for 'couldn't have.' Using the Kano matrix, we categorized features as M = Must-Have, A = Attractive, P = Performance, I = Indifferent, R = Reverse, or Q = Questionable.
Rather than relying solely on the category with the highest total, we adopted a comprehensive approach. We calculated satisfaction and dissatisfaction coefficients for each feature by considering the complete range of user attitudes expressed.
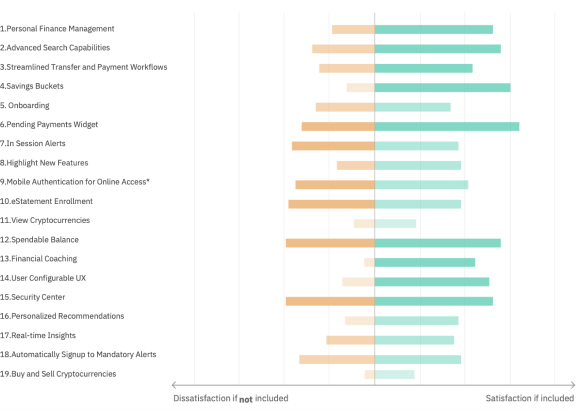
Step 5: Plotting prioritization scatter chart
We positioned each feature on the prioritization scatter chart, using satisfaction as the Y-value and dissatisfaction as the X-value. This visual representation allowed us to categorize features based on user satisfaction, dissatisfaction, and their relative importance.
The size of each dot on the chart was determined by the importance value assigned to the respective feature.
The size of each dot on the chart was determined by the importance value assigned to the respective feature.

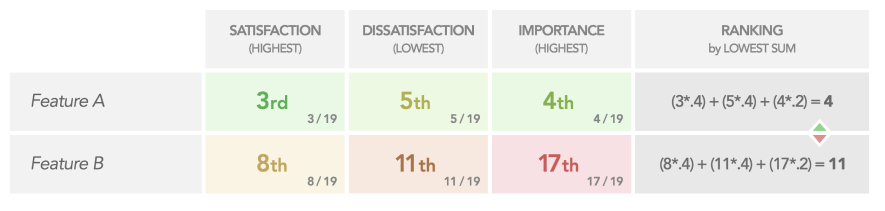
Step 6: Rank features based on satisfaction, dis-satisfaction & importance scores
To create a definitive list of features, we take each item’s individual ranking in each of the three high-level categories. Since the importance ranking is highly variable from user to user, a higher weight is applied to satisfaction and dissatisfaction (40% each to satisfaction and dissatisfaction with 20% to importance). An additional factor is added to Must Have features, and after weighting, the rankings are summed, with the lowest values representing the highest priority.
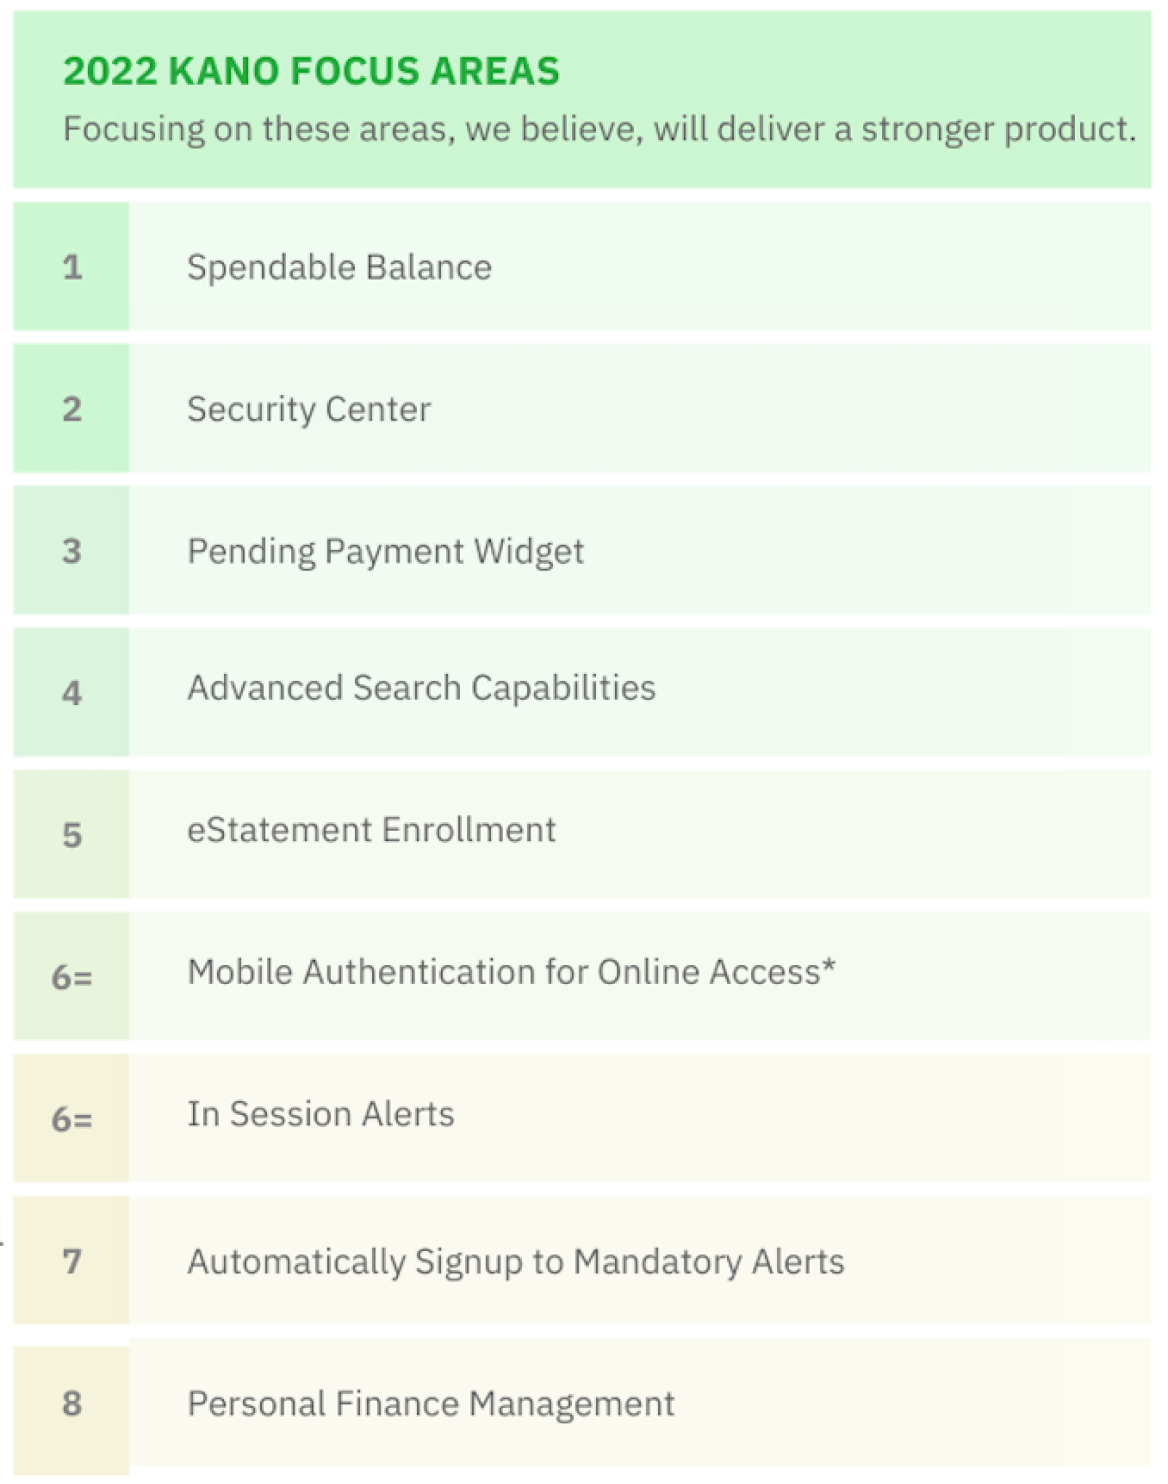
Insights
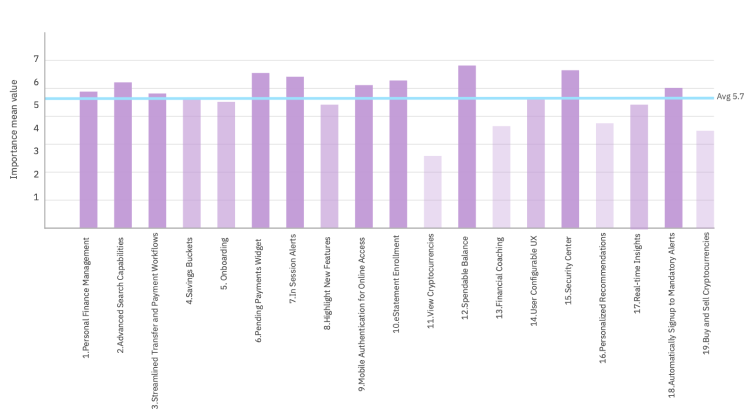
1. The Efficiency and Proactive Features: Users highly value efficiency in their banking experience, favoring features like "Spendable Balance," "Pending Payment Widget," "PFM," "eStatement Enrollment," and "Advanced Search." These features allow users to manage their finances efficiently and proactively, minimizing the time spent in their banking apps.
2. Pandemic-Driven Shift: The COVID-19 pandemic has driven users to prioritize efficiency and convenience in their online banking. This shift from in-branch to online banking underscores the importance of streamlined online features.
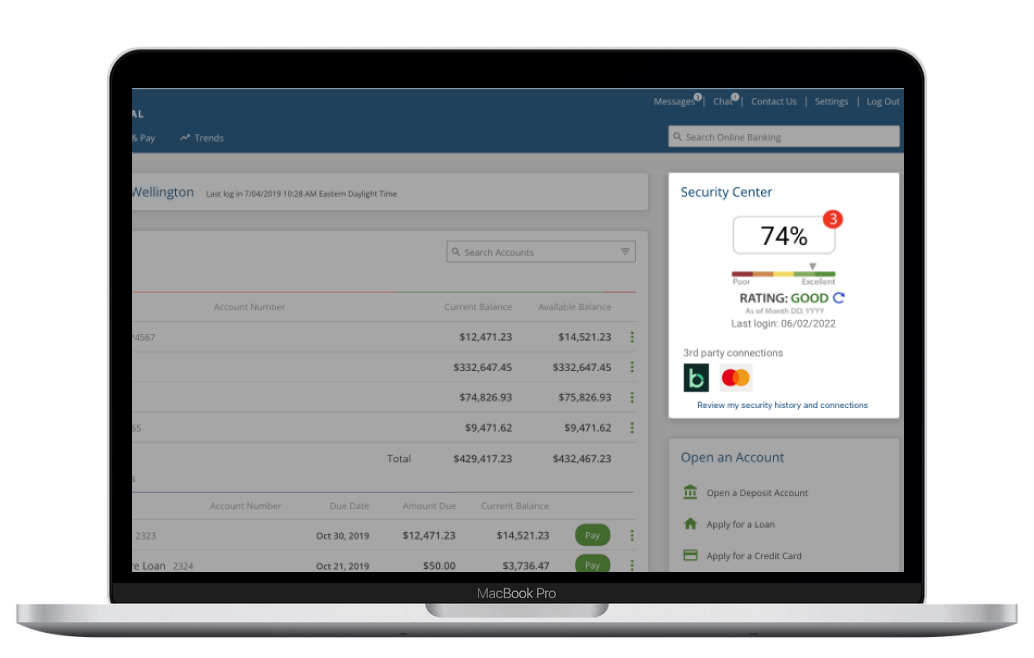
3. Security Concerns: Surprisingly, "Security Center" ranks second in importance. This feature is especially crucial for the "Old Rich" segment, reflecting users' strong desire for robust security measures and easy access to security details.
4. Efficiency Boosts Engagement: Features like "Spendable Balance" and "Pending Payment Widget" not only meet user demands but also boost engagement by enabling shorter, more frequent online and mobile banking sessions.
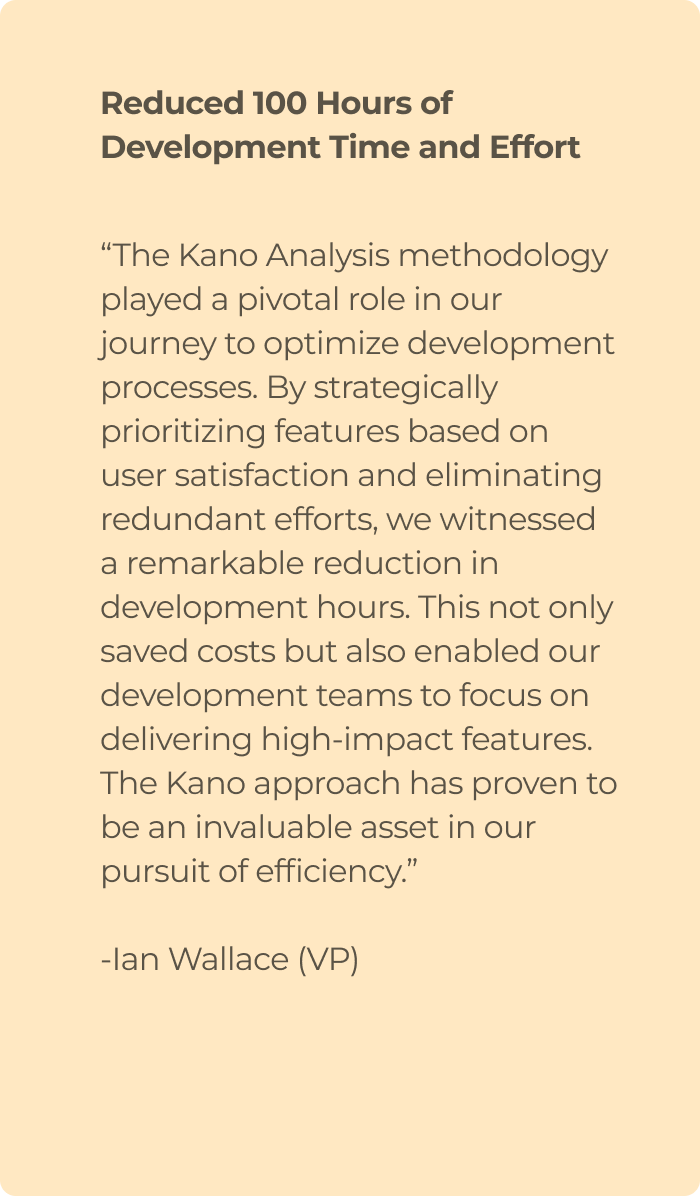
Impact: Delivering tangible results

Next steps
- Automate certain Kano processes.
- Compare the feature progression over the years.
- Compare features performance across demographic segments
Challenges
-Manual response checks to ensure data quality
-Manually transferring survey information from downloaded userzoom excel document into the Kano analysis template
-